| Output Section - Graphs/Axes |
|
| Output Section - Graphs/Axes |
|
|
|
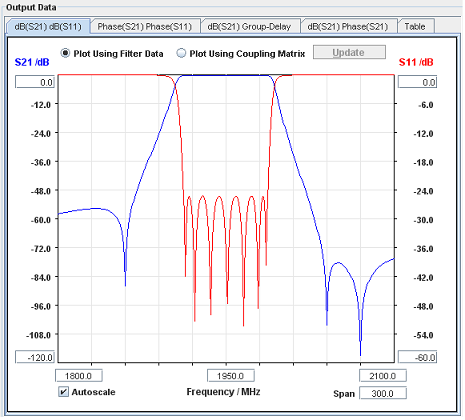
| Frequency axis: |
| Once a
characteristic is calculated and plotted the curves can be rearranged by
changing start, stop, span or center values on the frequency axis. When a frequency value is changed the RETURN button must be pressed in order for a new plot to be updated. Only one field can be changed at a time. Changes of frequency axis values always initiate a new full simulation - which means that the graph may take a few moments to update. |
| Y - axes: |
| These axes may have their start and stop values changed independently. Changing the scaling of these axes do not initiate new simulations and are much faster updated than the frequency axis. The RETURN button must be pressed in order for a plot to be updated. |
| The Auto scale check button scales both vertical axes according to their min and max values. |
|
|
© 2017, Guided Wave Technology - All Rights Reserved