| Output Section - Graphs |
|
| Output Section - Graphs |
|
|
|
||
| The graphical output from the Coupling Matrix Synthesis program is arranged as a number of tabbed panes, each displaying a certain combination of filter characteristics. | ||
| There are tabs for displaying the following parameters: |
||
|
||
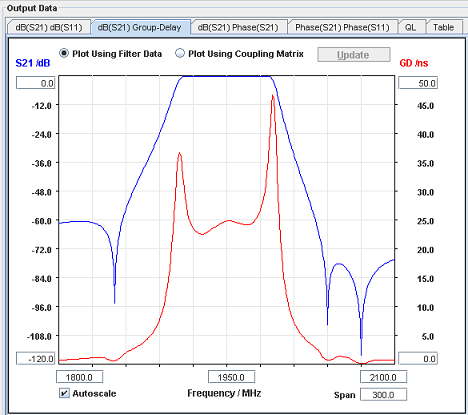 |
S21 in dB versus
group delay.
|
|
| The 'hump' around the center frequency in the group delay characteristic, is the result of a pair of complex transmission zeroes. | ||
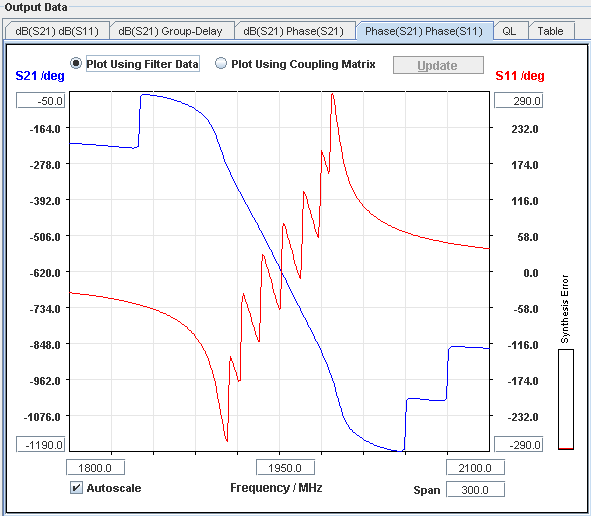 |
Phase
of S21 and S11.
|
|
|
|
||
|
|
||
| The graphs can be arranged by changing the values on the axes. | ||
| Curve values can be red out by inserting markers. | ||
© 2017, Guided Wave Technology - All Rights Reserved