| Output Section - Graphs - Plot Using Filter Data - Plot Using Coupling Matrix |
|
| Output Section - Graphs - Plot Using Filter Data - Plot Using Coupling Matrix |
|
|
|
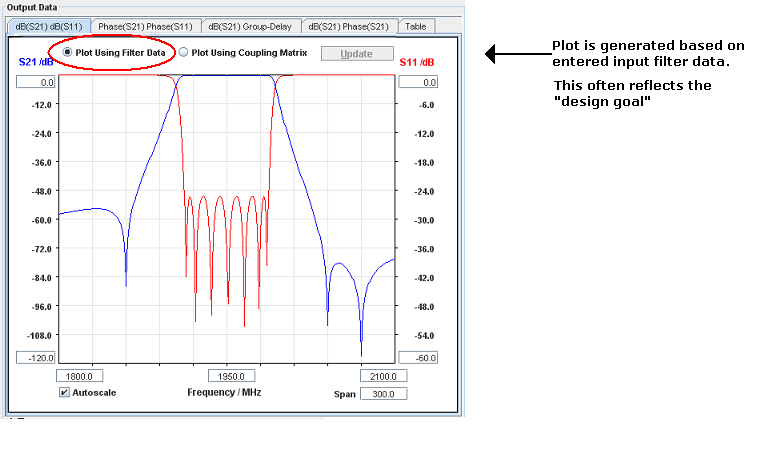
| Above the S-parameter display field two radio buttons are positioned. |
| Plot Using Filter Data - button |
|
When this button is selected the displayed S-parameter curves reflect the filter data, which is entered in the Input Data section - i.e. N, f-center, BW, return loss, unloaded Q and transmission zeroes. The displayed curves will often be the design goal, which the filter designer is aiming at. If one is only interested in
the S-parameter characteristics, the topology
matrix need not to be accurately defined. |
|
|
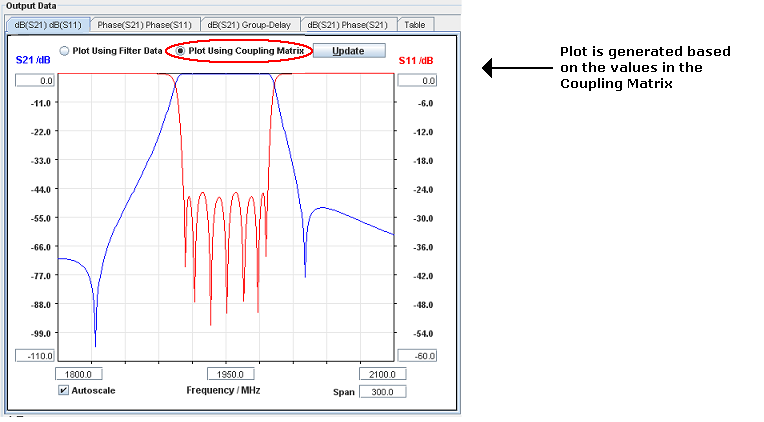
| Plot Using Coupling Matrix - button |
| When the filter
designer has achieved a satisfactory set of design goal characteristics,
the topology matrix should finally be defined.
The topology matrix defines the allowed coupling paths in the filter.
If a topology is defined, which can not fully implement the design goal characteristics, the synthesis error will become large (see error indicator). This would e.g. be the case if only main-line-couplings were allowed in the topology matrix, but one or more finite (i.e. different from 1e12 MHz) transmission zeroes were entered in the Input Data section. |
| The
actually achieved filter characteristics can be inspected by selecting the
"Plot Using Coupling Matrix" button. When this button is selected the filter characteristics are calculated - and plotted - based on the synthesized coupling-matrix. The "Plot Using Coupling Matrix" button therefore shows "what you get", where the "Plot Using Filter Data" button shows "what you want". |
|
|
| There will be no difference between the two display options if it is possible to synthesize the wanted filter characteristic within the defined topology. |
| Update |
| This button is intended for updating the S-parameter graphs when editing the coupling matrix values. |
© 2017, Guided Wave Technology - All Rights Reserved